Abstract
This report emphasises the whole process of creating a visual interface about UK qualifications to explore the UK’s socio-economic impacts. In the data processing section, the data sources, the abstraction structure, and the treatment of missing values are discussed. In the task definition part, Munzner’s thinking method is used to enumerate the problems to be solved. In visualisation validation, we justify the effectiveness of data, projections with two algorithms, graph types, colours and possible user groups. The conclusion section shows the fun facts about qualifications, locations, and age that users can learn by using the dashboard. The reflection I learned about data processing and visualization is also included.
Introduction
We aim to explore the socio-economic feature of different birth country groups living in England and Wales. Many socio-economic metrics include economic activity, qualifications, occupation, national identity, etc. [1]. This report focuses on the highest qualifications distribution to measure socio-eco life. The age and UK region distributions are supplement attributes of qualifications analysis.
The data are based on the 2011 Census of England and Wales. First, we abstract and preprocess raw datasets to eliminate redundancy and increase data scalability. Then, feature reduction methods, principle component analysis (PCA) [2] and Umap [3], are used to extract key features for projection. PCA is a linear method of extracting the dominant component in place of the original data. It is also known as the Karhunen- Loeve transformation. Umap is a non-linear feature reduction method in the class of k- neighbours based graph learning algorithms. It is good at retaining the overall features’ structure. Last, we visualise an interactive presentation with a map, dot plot, bar chart, and scatter plot of projection analysis presented to the end-user.
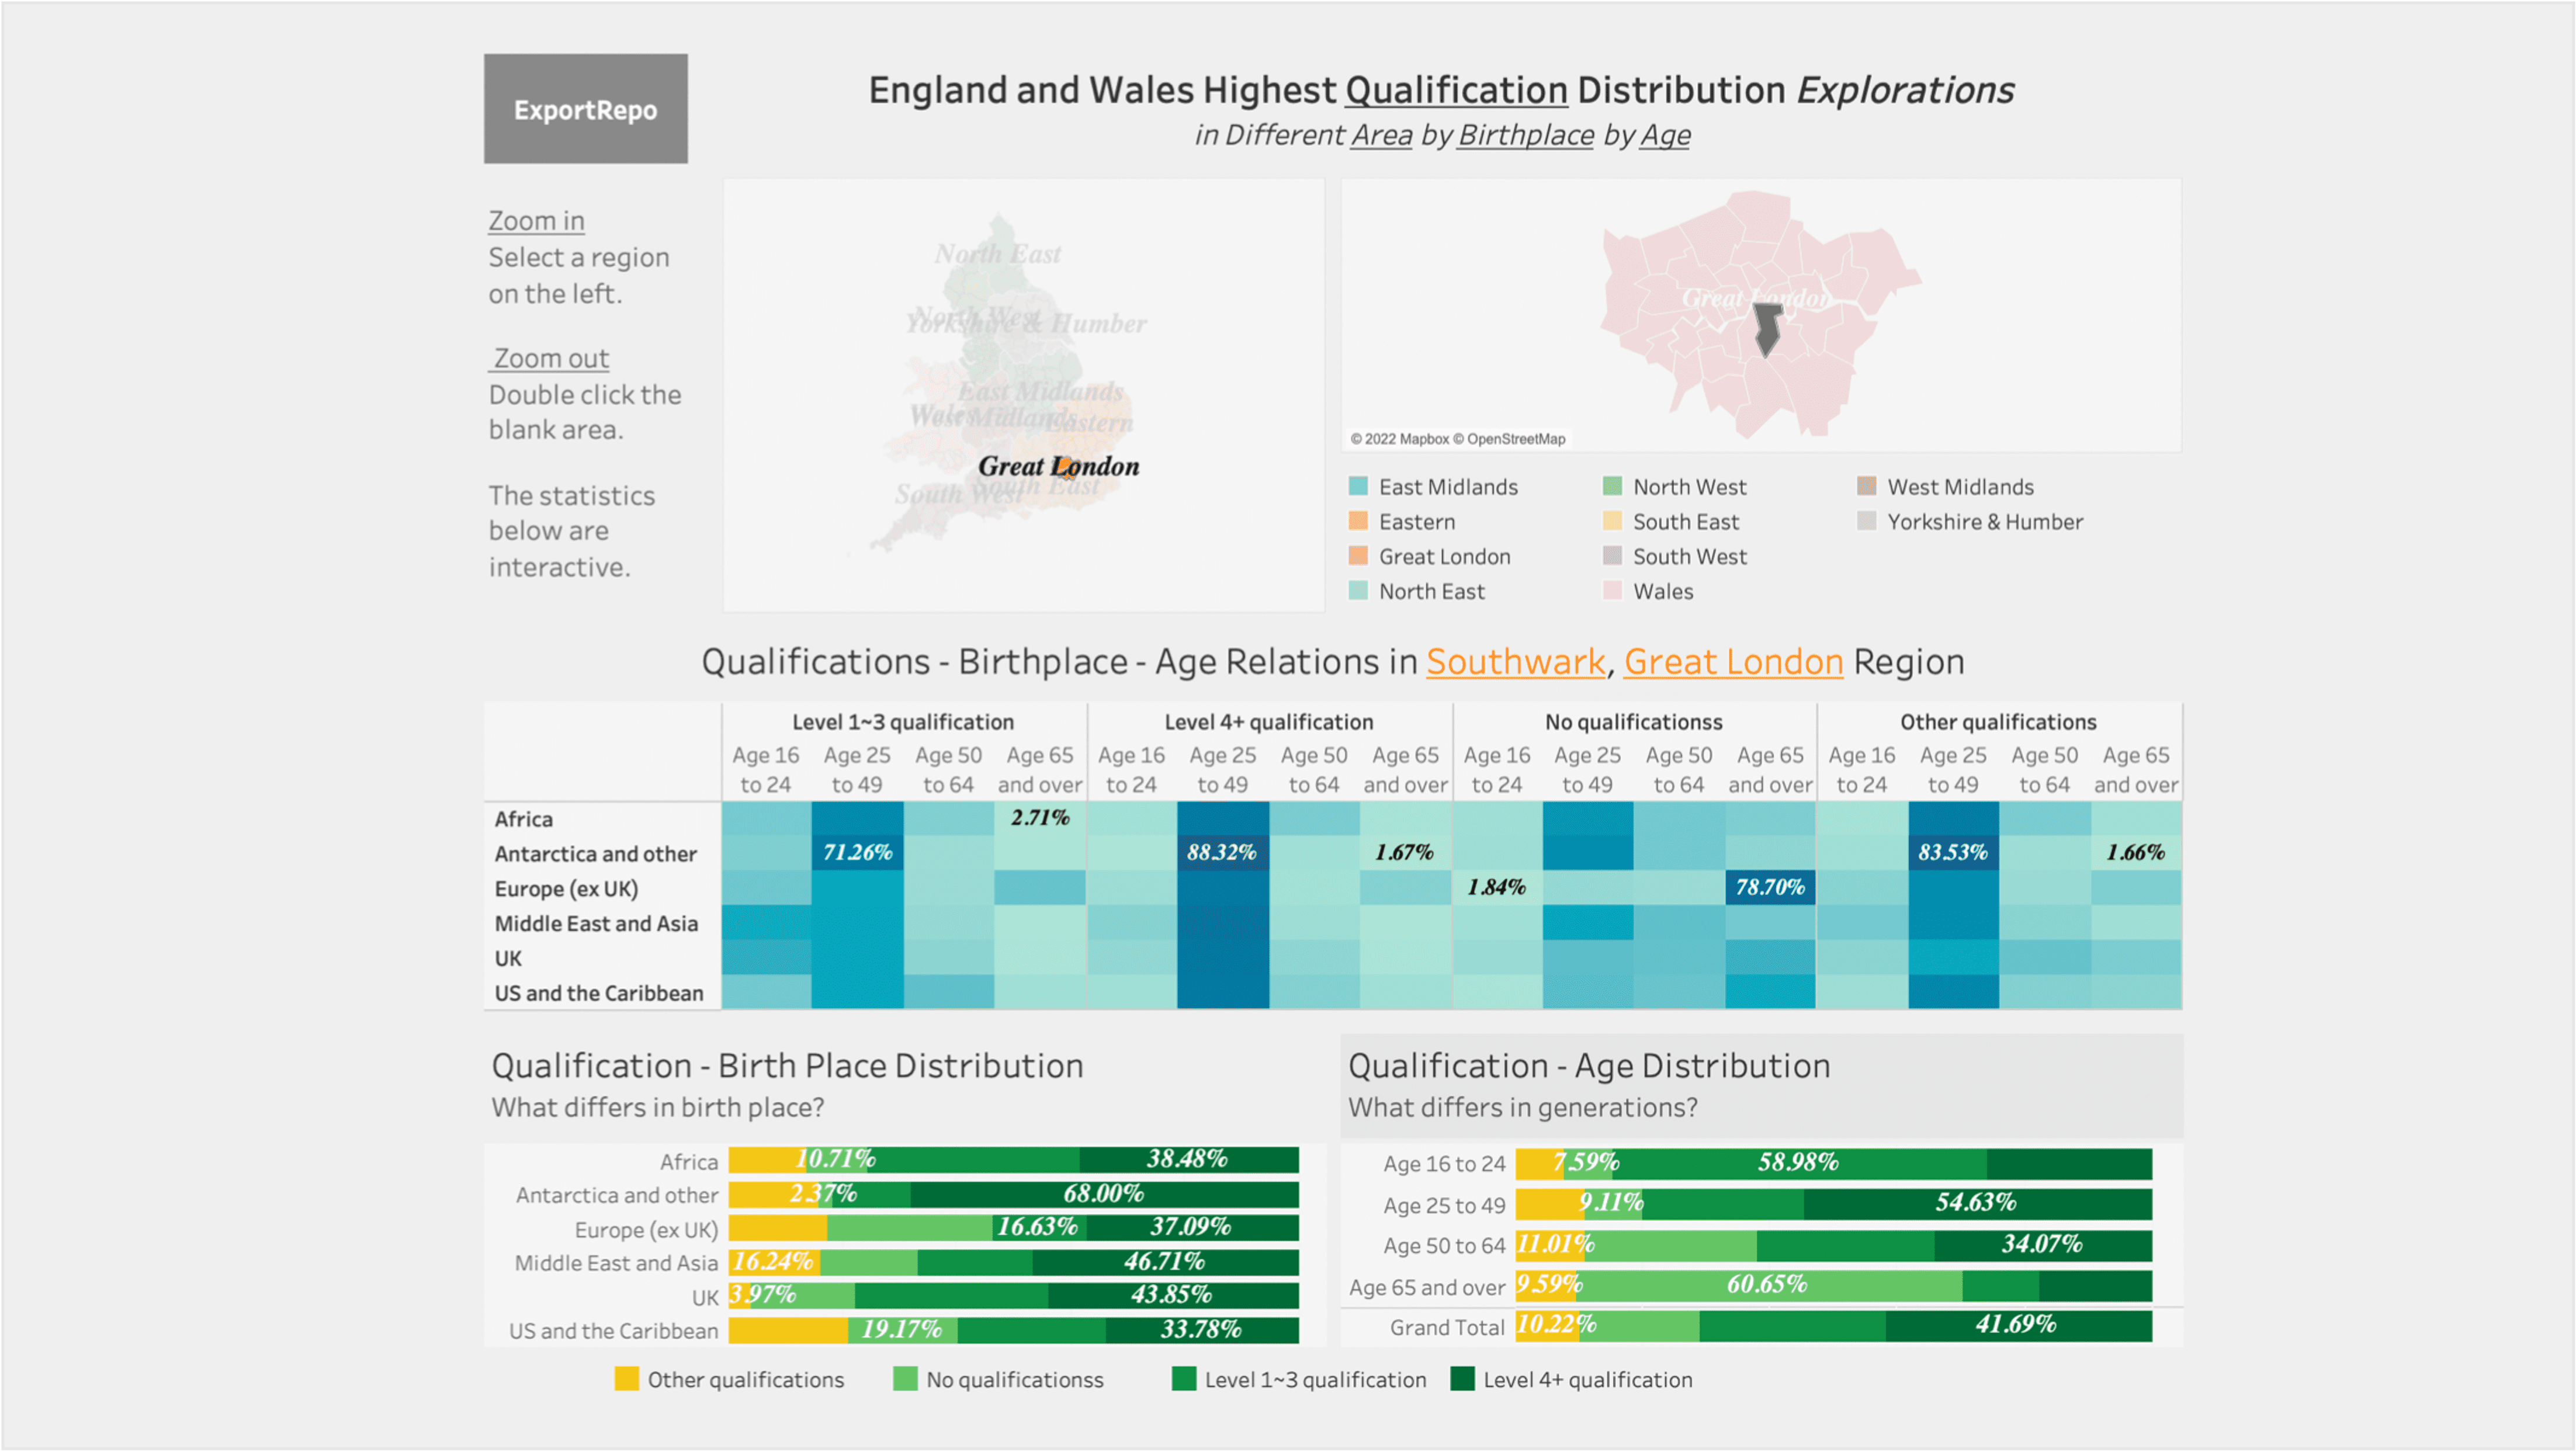
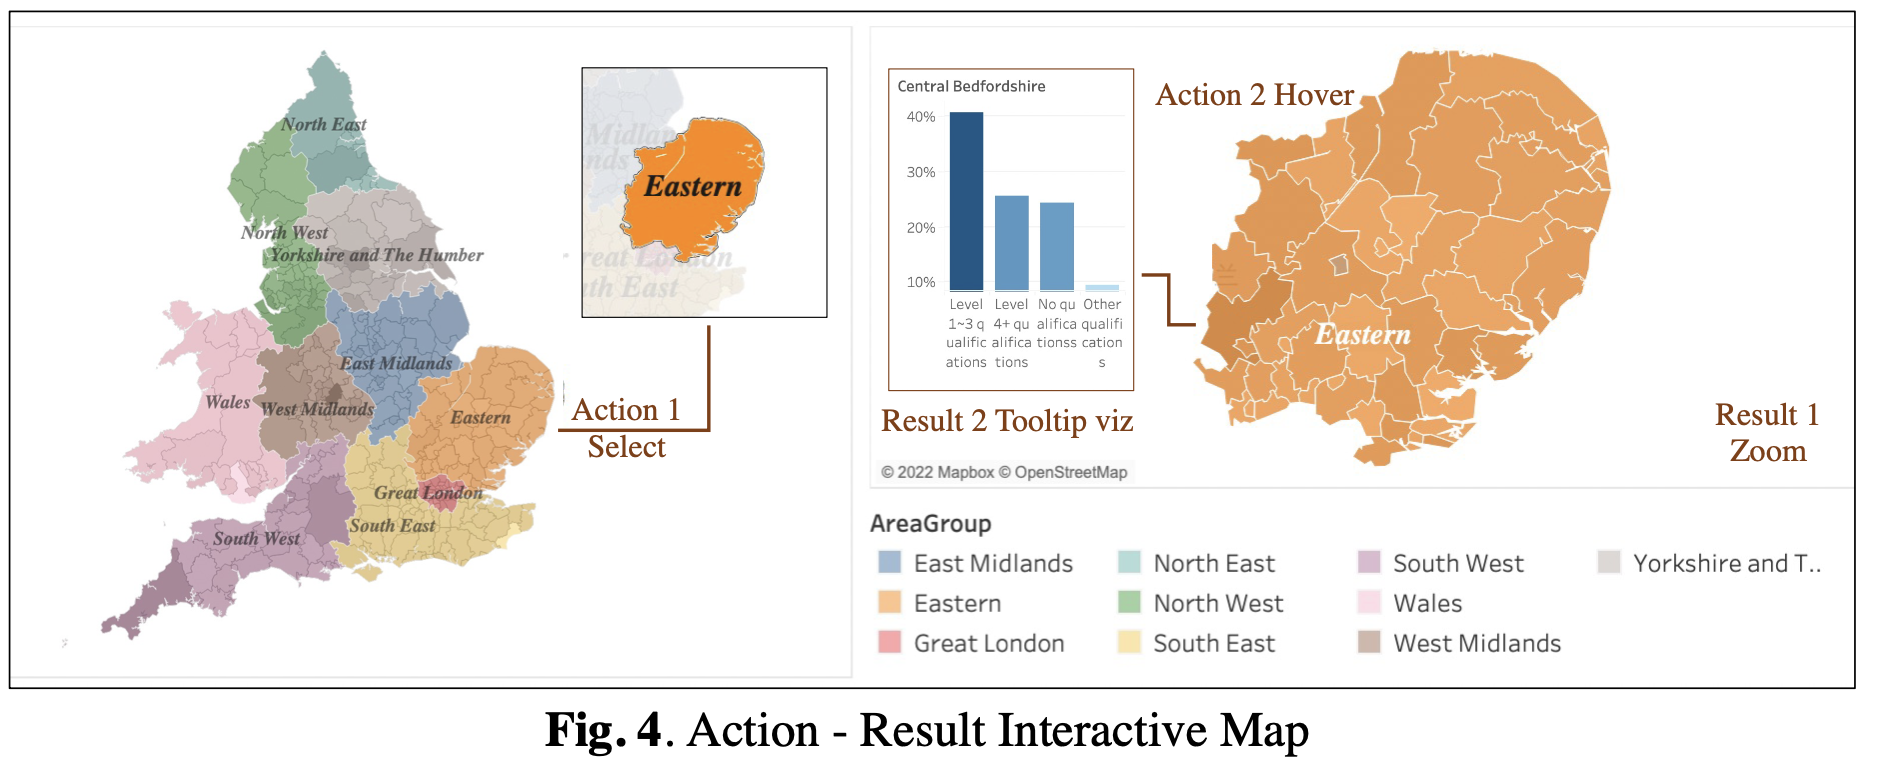
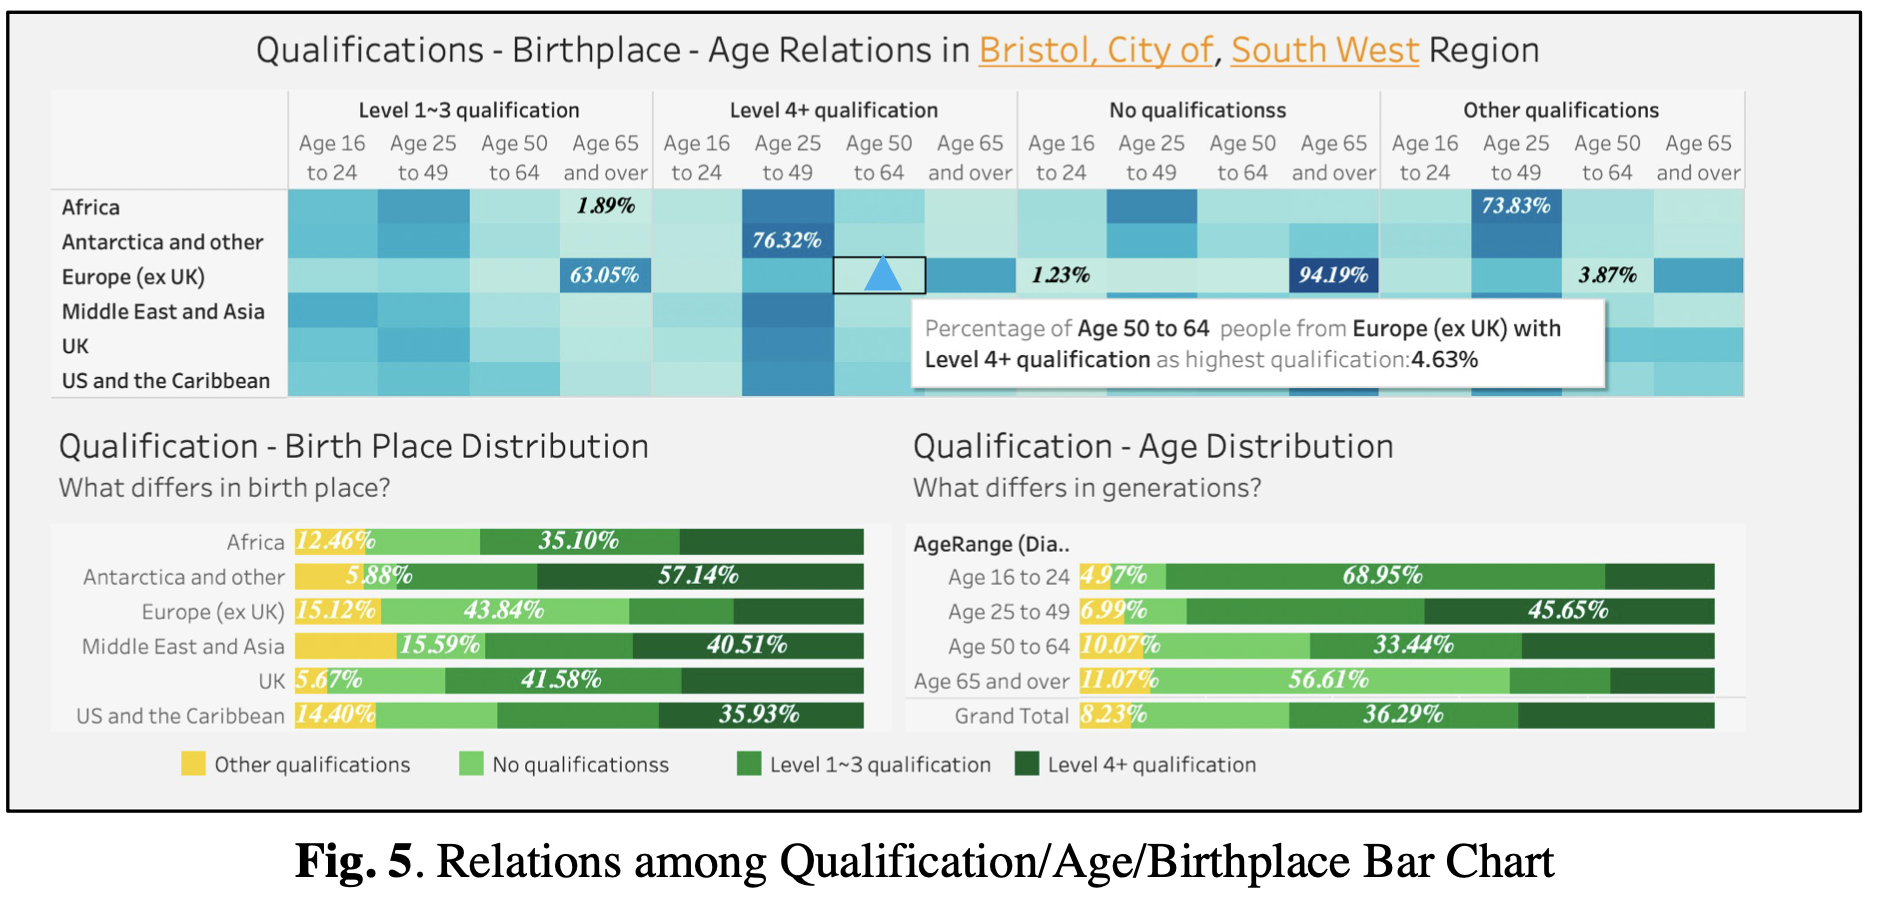
Screenshots Demo
Conclusion – What users have learned
There are some key points for the whole of England and Wales.
(1) Over half of those over 65 have no qualifications, while this ratio is only 10% for the 16–24-year-olds group. Moreover, 69.93% of them have a bachelor’s degree or higher. The age span of these two groups is around fifty years, which in part reflects UK’s positive socio-economic development. The UK attracts more overseas students for higher education, and more residents have chances to pursue higher education.
(2) For birthplace, over half of those born in and around Australia have a level 4 qualification or above, and around 40% of those born in European countries do not have any qualifications. This is likely to be related to geographical location and migration. Australia is far away from the UK. Most residents are for work or study. Either of two is more likely to require higher qualifications. For geographic concerns, there are closer communications between the UK and European countries. Hence, the age range of Europeans living in the UK is more balanced. It leads to a more balanced qualification distribution as well.
(3) For the district level, the highest proportion of qualifications in the Great London Region is level 4 or above, while other regions are all level 1 to 3. London attracts students and workers for its rich educational resources and finance. This highly educated population form a positive feedback London region’s development. To some extent, the distribution of qualifications could reflect the economic structure of the region (financial/industrial orientation)
Leave a Reply